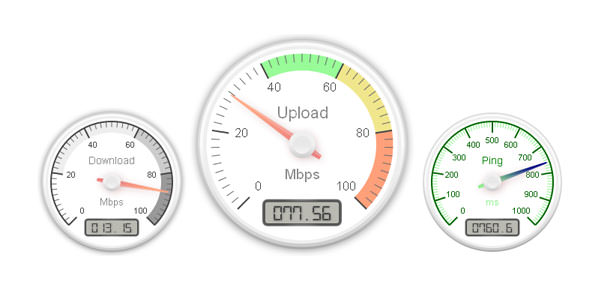
A tiny gauge by using pure JavaScript and HTML5 canvas. CanvGauge allows you to make various customizable gauges on an HTML page within element. It does not require any other external library like jQuery.
Why canvas gauge? Because it is compatible with most modern browsers and with mobile devices. For example, SVG, does not work on Android 2.x by default, but canvas do work.
BTW you can find your own reasons why to use canvas.
See the Pen CanvGauge by wildminder (@wildminder) on CodePen.
How to install Canvas Gauges
Canvas gauges have different installation options. It can be downloaded as package for local use on your website or linked to CDN; installed from node package manager or simply used from source code.
According to specific needs the gauge library may be used as whole library or only partially to minimize size of additional components in the project. To install the whole library, run:
$ npm install canvas-gaugesIf you only need the exact type of the gauge it can be installed using the appropriate npm tag. Currently the following gauges are supported: linear, radial.
To install only linear gauge, run:
$ npm install canvas-gauges@linearTo install only radial gauge, run:
$ npm install canvas-gauges@radialTo clone the canvas gauge project use git command:
$ git clone [email protected]:Mikhus/canvas-gauges.gitGet Canvas Gauge From CDN
All-in-one
<script src="//cdn.rawgit.com/Mikhus/canvas-gauges/gh-pages/download/2.1.2/all/gauge.min.js"></script>Only radial gauge
<script src="//cdn.rawgit.com/Mikhus/canvas-gauges/gh-pages/download/2.1.2/radial/gauge.min.js"></script>Only linear gauge
<script src="//cdn.rawgit.com/Mikhus/canvas-gauges/gh-pages/download/2.1.2/linear/gauge.min.js"></script>Canvas Gauge configuration
The configuration options are provided to Gauge constructor as an object which could contain any of the parameters described below. The only one parameter is mandatory. So to create a gauge on a page it is enough to initialize it like this:
var gauge = new Gauge({ renderTo: 'canvas-id' }); gauge.draw();- renderTo - {String|HTMLCanvasElement} - HTML canvas element ID or element itself. This identifies the canvas element to which a gauge will be drawn. This parameter is mandatory to specify.
- width - {Integer} - canvas width in pixels
- height - {Integer} - canvas height in pixels
- title - {String} - the title which should be drawn on a gauge. By default is false (no title to display)
- minValue - {Number} - the minimal value which is used on a gauge bar. Default is 0
- maxValue - {Number} - the maximum value which is used on a gauge bar. Default is 100
- majorTicks - {Array} - array of a major tick marks. By default is ['0', '20', '60', '80', '100']
- minorTicks - {Integer} - number of minor ticks to draw between major ticks on a gauge bar. Default is 10.
- strokeTicks - {Boolean} - the flag which identifies if the ticks bar should be stroked or not. By default is true.
- units - {String} - specify a units name which will be shown on a gauge. By default is false (do not display the units).
- valueFormat - {Object} - specify how the value should be displayed. It is possible to specify an integer part of the value and the decimal part. By default is { int : 3, dec : 2 }
- glow - {Boolean} - indicates if shadow glow should be drawn for gauge plate or not
- animation - {Object} - Gauge needle animation config. Handles three options - delay, duration and animate function.
Examples:
animation : false /* no animation is used to display value on a gauge */ animation : { delay : 10, duration : 400, fn : 'elastic' } animation : { delay : 10, duration : 400, fn : function( p) { return Math.pow( p, 3) } /* cubic animation implementation */ }colors - {Object} - the colors to use on a different gauge parts when drawing. Could be specified in hex ('#000000' - '#ffffff') or RGB with/without the alpha channel. Defaults are:
plate      : '#fff',
majorTicks : '#444',
minorTicks : '#666',
title      : '#888',
units      : '#888',
numbers    : '#444',
needle     : { start : 'rgba(240, 128, 128, 1)', end : 'rgba(255, 160, 122, .9)' }
highlights - {Array} - an array of highlights colors which could be drawn on a gauge bar. If specified as an empty array or false will not be drawn. By default is:
[{ from: 20, to: 60, color: '#eee' }, { from: 60, to: 80, color: '#ccc' }, { from: 80, to: 100, color: '#999' }]Where from is a value to start highlight draw from, to - the value to which highlight draw to, color - the color to use.
Methods
- Gauge( {Object} options) - constructor. Takes configuration options as an argument. Configuration options are described above.
- draw() - draws the gauge (renders it on specified canvas)
- clear() - immediately sets the gauge value to minimal one and re-draws the gauge
- setValue( {Float} value) - sets a new value to display within the gauge. If animations is enabled - starts an animation.
- getValue() - returns the current value on a gauge
Events
onready - A good practice is to use this even if it is required to dynamically work with the gauge (change the value) and be assured that the gauge was correctly initialized and drawn before the dynamic updates was started.
Canvas Gauge Examples:
See the Pen CanvGauge Examples by wildminder (@wildminder) on CodePen.
Zero Configuration Gauges
<canvas data-type="radial-gauge"></canvas>
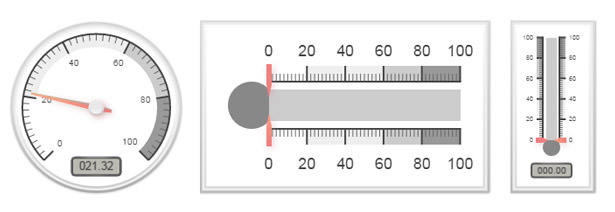
<canvas data-type="linear-gauge"></canvas>
<canvas data-width="100" data-type="linear-gauge"></canvas>
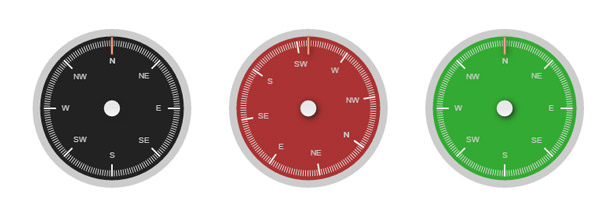
Radial Gauges as Compass
<canvas data-type="radial-gauge"
    data-min-value="0"
    data-max-value="360"
    data-major-ticks="N,NE,E,SE,S,SW,W,NW,N"
    data-minor-ticks="22"
    data-ticks-angle="360"
    data-start-angle="180"
    data-stroke-ticks="false"
    data-highlights="false"
    data-color-plate="#222"
    data-color-major-ticks="#f5f5f5"
    data-color-minor-ticks="#ddd"
    data-color-numbers="#ccc"
    data-color-needle="rgba(240, 128, 128, 1)"
    data-color-needle-end="rgba(255, 160, 122, .9)"
    data-value-box="false"
    data-value-text-shadow="false"
    data-color-circle-inner="#fff"
    data-color-needle-circle-outer="#ccc"
    data-needle-circle-size="15"
    data-needle-circle-outer="false"
    data-animation-rule="linear"
    data-needle-type="line"
    data-needle-start="75"
    data-needle-end="99"
    data-needle-width="3"
    data-borders="true"
    data-border-inner-width="0"
    data-border-middle-width="0"
    data-border-outer-width="10"
    data-color-border-outer="#ccc"
    data-color-border-outer-end="#ccc"
    data-color-needle-shadow-down="#222"
    data-border-shadow-width="0"
    data-animation-duration="1500"
></canvas>
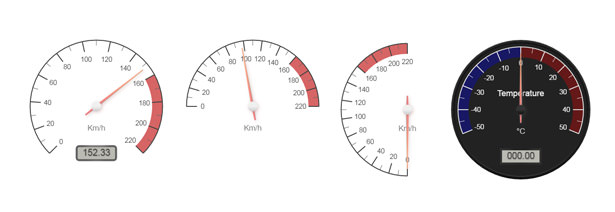
Custom Radial Gauges
<canvas data-type="radial-gauge"
data-width="300"
data-height="300"
data-units="Km/h"
data-min-value="0"
data-max-value="220"
data-major-ticks="0,20,40,60,80,100,120,140,160,180,200,220"
data-minor-ticks="2"
data-stroke-ticks="true"
data-highlights='[
{"from": 160, "to": 220, "color": "rgba(200, 50, 50, .75)"}
]'
data-color-plate="#fff"
data-border-shadow-width="0"
data-borders="false"
data-needle-type="arrow"
data-needle-width="2"
data-needle-circle-size="7"
data-needle-circle-outer="true"
data-needle-circle-inner="false"
data-animation-duration="1500"
data-animation-rule="linear"
></canvas>Custom Linear Gauges
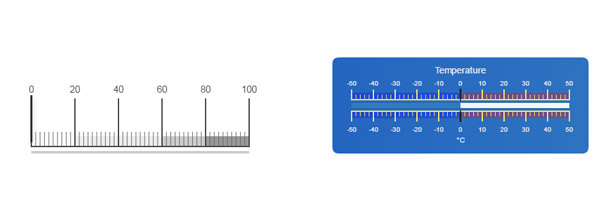
<canvas data-type="linear-gauge"
data-width="400"
data-height="150"
data-units="°C"
data-title="Temperature"
data-min-value="-50"
data-max-value="50"
data-major-ticks="[-50,-40,-30,-20,-10,0,10,20,30,40,50]"
data-minor-ticks="5"
data-stroke-ticks="true"
data-ticks-width="15"
data-ticks-width-minor="7.5"
data-highlights='[ {"from": -50, "to": 0, "color": "rgba(0,0, 255, .3)"},
{"from": 0, "to": 50, "color": "rgba(255, 0, 0, .3)"} ]'
data-color-major-ticks="#ffe66a"
data-color-minor-ticks="#ffe66a"
data-color-title="#eee"
data-color-units="#ccc"
data-color-numbers="#eee"
data-color-plate="#2465c0"
data-color-plate-end="#327ac0"
data-border-shadow-width="0"
data-borders="false"
data-border-radius="10"
data-needle-type="arrow"
data-needle-width="3"
data-animation-duration="1500"
data-animation-rule="linear"
data-color-needle="#222"
data-color-needle-end=""
data-color-bar-progress="#327ac0"
data-color-bar="#f5f5f5"
data-bar-stroke="0"
data-bar-width="8"
data-bar-begin-circle="false"
></canvas>





This is really cool. How do I get 2 gauges side by side? In other words, how to create logical gauge clusters? Thanks!
You create 2 canvas each with one gauge but different names 🙂
Best regards
Thanks. very nice Gauge
Very nice! Is there a way to hide the digital LCD? Thanks!
This is awesome. How would you go about dynamically updating the setValue function from a mysql database. I have a php script that counts (mysql_num_rows) and I echo out the number. I know how to make it automatically update in real time using ajax.
$(document.ready(function) { $(“#responsecontainer.load(“getrows.php; var refreshId = setInterval(function) { $(“#responsecontainer.load(‘getrows.php?randval=’+ Math.random; }, 1000;
};
But how can I update the gauge.setValue( ; so that the gauge moves in real time as well? Awesome gauge by the way! Thanks and Cheers!
Hi, what a wonderful job !
I have a problem when I want to update a gauge with the setValue) method. I explain :
In the body I have a canvas
Nest I have a function exactly the same as in the example without the onready event.
All is working fine if in the function I put a mygauge.setValue(10) the needle point on 10.
function showGauge) {
var mygauge = new Gauge({
.
};
mygauge.setValue(10;
mygauge.draw;
Now I remove the mygauge.setValue(10) in the shaowGauge) function and after the I put an input button with an onchange event :
The needle stay on 0.
I have make a text with an alert box, the this.value is displayed well.
I can’t find wher is my mistake.
Looking forward to rreading you.
Best regards.
Is there any way, we can change the major ticks and numbers without initializing the gauge? Thank you.
everything is alright.i want change digital meter color.is there any option to change digital meter Background color and Font color also.
Nice post. I was checking continuously this weblog and I’m impressed! Extremely helpful info specifically the last part ) I deal with such information much. I was looking for this particular information for a long time. Thanks and best of luck.
Very nice Gauge.
Is it possible to display more needles?